


By continuing to truly focus upon babies, we want to make the world more baby-friendly.
At the same time, we aim to achieve sustainable growth as a company by reducing environmental impact and solving social issues surrounding babies and families in all countries and regions where we conduct business activities. We particularly recognize the urgency of climate change, identifying it as one of our most important management challenges and outlining measures to tackle it.
Greenhouse Gas (GHG) Emissions Reduction Targets and Performance
In April 2025, the Pigeon Group‘s 2030 greenhouse gas (GHG) emission reduction targets validated for its near-term science-based targets (SBT) from the SBTi.
Pigeon Group aims to reduce Scope 1&2 GHG emissions by 70% (compared to FY2018) and Scope 3 Category 1&12 GHG emissions by 25% (compared to FY2021) by 2030, and to promote GHG emissions reduction throughout the supply chain.
In addition, in our Eighth Med-Term Business Plan (2023-2025), we have set our interim target of reducing Scope 1&2 GHG emissions by 63% compared to FY2018 by 2025. Each business segment has incorporated this interim target into its own med-term business plan and is working to reduce GHG emissions through the use of renewable energy, energy conservation, and the exploration of low-carbon materials.
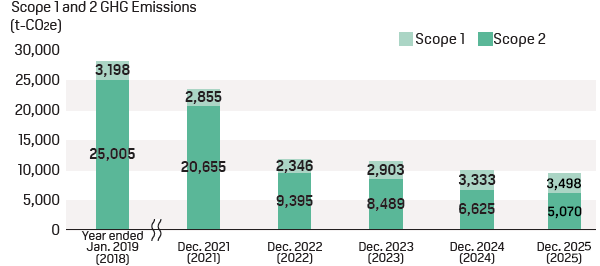
Pigeon Group's Scope 1 and 2 Greenhouse Gas (GHG) Emissions
In FY2025, the Pigeon Group’s GHG emissions totaled 8,568t-CO2e, comprising 3,498t-CO2e for Scope 1 and 5,070t-CO2e for Scope 2. Due to proactive reduction efforts—including the transition to renewable electricity, the installation of solar panels for on-site generation, the purchase of renewable energy certificates, and ongoing energy-saving initiatives—our combined Scope 1 and 2 emissions decreased by 19,636t-CO2e (69.6%) compared to the base year (FY2018: 28,203t-CO2e).
Unit: tonnes of CO2e
| Business segment | FY2018 (base year) |
FY2019 | FY2020 | FY2021 | FY2022 | FY2023 | FY2024 | FY2025 | |
| GHG Emission |
GHG Emission | GHG Emission |
GHG Emission |
GHG Emission | GHG Emission | GHG Emission | GHG Emission | Base year difference (vs. FY2018) |
|
| Group total | 28,203 | 26,931 | 24,973 | 23,510 | 11,741 | 11,392 | 9,958 | 8,568 | -19,636 |
|---|---|---|---|---|---|---|---|---|---|
| Japan Business | 6,232 | 5,496 | 5,265 | 3,947 | 3,490 | 3,416 | 2,875 | 1,859 | -4,373 |
| China Business | 9,884 | 8,886 | 8,923 | 8,737 | 4,346 | 4,582 | 3,838 | 3,803 | -6,081 |
| Singapore Business | 11,305 | 11,306 | 10,442 | 10,610 | 3,786 | 3,277 | 3,133 | 2,777 | -8,528 |
| Lansinoh Business | 782 | 1,243 | 343 | 216 | 118 | 117 | 112 | 128 | -654 |
■Boundary of calculations
Pigeon Corporation and all its consolidated subsidiaries in Japan and overseas, including Lanshinoh Business (Coverage: 100%)
In defining the organizational boundary, we have adopted the Financial Control approach. This includes all consolidated subsidiaries within our financial reporting scope.
Scope 1 emissions: For the period January 2019 to December 2022, only CO2 emissions from energy sources are included in the scope of calculation; from the period December 2023, non-energy greenhouse gases including methane and nitrous oxide are also included in the scope of calculation.
Scope 2 emissions: Emissions are calculated on a market basis. Where supplier-specific CO2 emission coefficients are available, we use those coefficients. If not available, we use the average CO2 emission factor of the local country or grid. CO2 emission coefficients are set to zero for electricity consumption corresponding to the amount of renewable energy certificates (electricity) purchased.
Independent Verification on Greenhouse Gas Emissions
In order to improve the reliability of greenhouse gas emission data, in the fiscal year ending December 2024, Pigeon Co., Ltd. and its domestic and overseas group companies (42 locations in total) underwent Independent verification by the Japan Quality Assurance Organization for their Scope 1 and Scope 2 greenhouse gas emissions. Pigeon Group Scope 1 & 2 greenhouse gas emissions account for 100% of 11,741 tons of CO2 (Scope 2 greenhouse gas emissions are calculated based on market standards).

Pigeon Group's Scope 3 GHG emissions
Pigeon Group recognizes the need to identify not only Scope 1 and Scope 2 greenhouse gas emissions from our production and non-production sites, but also greenhouse gas emissions throughout the entire value chain, including raw and packaging materials, transportation, use of sold products, and end-of life treatment of sold products (scope 3 emissions) and the need to work with our business partners to reduce scope 3 emissions.
The Scope 3 GHG emissions of the entire Pigeon Group (Japan Business, China Business, Singapore Business and Lansinoh Business) in 2024 were 209.9 thousand tonnes of CO2e. The largest proportion of Scope3 emissions was Category 1 emissions from purchased goods and services, which amounted to 150.1 thousand tonnes of CO2e, accounting for 72% of total Scope 3 emissions.
To reduce GHG emissions from purchased products and services (Category 1), we consider it essential to work with our suppliers, and since 2023 we have used the the CSR Procurement Self-Assessment Questionnaire to collect the Scope 1 and Scope 2 GHG emissions data of our suppliers.
Pigeon Group's Scope 3 GHG emissions
|
Categories |
FY2021 |
FY2023 |
FY2024 |
||
|
GHG emissions |
GHG emissions |
GHG emissions |
Ratio |
||
| Category 1 | Purchased goods and services | 196,107 | 157,673 | 150,123 | 72% |
| Category 2 | Capital goods | 20,189 | 19,550 | 10,335 | 5% |
| Category 3 | Fuel- and energyrelated activities not included in Scope 1 or Scope 2 | 4,349 | 3,542 | 3,745 | 2% |
|
Category 4 |
Upstream transportation and distribution |
14,810 | 11,101 | 14,796 | 7% |
| Category 5 | Waste generated in operations | 3,986 | 2,932 | 2,345 | 1% |
| Category 6 | Business travel | 340 | 1,439 | 1,451 | 1% |
| Category 7 | Employee commuting | 2,307 | 2,768 | 2,454 | 1% |
| Category 9 | Downstream transportation and distribution | 3,911 | 4,211 | 4,799 | 2% |
| Category 11 | Use of sold products | 3,244 | 4,832 | 6,066 | 3% |
| Category 12 | End-of-life treatment of sold products | 16,229 | 12,671 | 13,796 | 7% |
| Category 14 | Franchises | 17 | 12 | 3 | 0% |
| Total | 265,489 | 220,731 | 209,913 | - | |
*To achieve SBT (Science-Based Target) certification in 2024, we have partially revised our calculation methodology and recalculated our Scope 3 GHG emissions for the base year 2021 and 2023.
■ Boundary of calculations
Pigeon Corporation and all the consolidated subsidiaries in Japan and overseas, including Lanshinoh Business. (Coverage: 100%)
Duplicate GHG emissions occurred from intra-group trading between Japan, China, Singapore and Lansinoh Businesses have been deleated.
For the GHG emissions calculation methods of each category, please refer to the Pigeon ESG Databook.
Lansinoh Group's Long-term Targets for Reduction of Greenhouse Gas Emissions
We recognize the importance of addressing climate change throughout our value chain. In FY2020, our Lansinoh Group set a long-term goal of achieving climate neutrality by 2030 and committed to net zero emissions by 2050 for the entire value chain. These plans align with the Paris Agreement, which strives to limit global warming to 1.5℃ above pre-industrial levels. The short-term reduction target for 2030 was verified and approved by the Science Based Targets initiative (SBTi) in FY2020, and the long-term reduction target for 2050 was verified and approved by SBTi in FY2025.
The net-zero commitment covers scopes 1, 2, and 3 of the entire Lansinoh business, which accounts for 20.6% of consolidated net sales. (2024 actual)
Lansinoh Group
Overall net zero target
・Achieve net zero greenhouse gas emissions across the entire value chain by 2050
Short-term targets
・Reduce Scope 1 & 2 greenhouse gas emissions by 46.2% by 2030 (base year 2019) *
*The target includes land-related emissions and sinks derived from bioenergy feedstocks
・Reduce Scope 3 greenhouse gas emissions by 33% by 2030 (base year 2019)
Long-term target
・Reduce Scope 1, 2, and 3 greenhouse gas emissions by 90% by 2050 (base year 2019) *
*The target includes land-related emissions and sinks from bioenergy feedstocks.
Categories covered by Scope 3 reduction targets and Net Zero commitment:
Category 1: Purchased goods and services, Category 2: Capital goods, Category 4: Upstream transportation and distribution, Category 5: Waste generated in operations, Category 6: Business travel,
Category 7: Employee commuting, Category 9: Downstream transportation and distribution, Category 11: Use of sold products, Category 12: End-of-life treatment of sold products
Lansinoh Group's Greenhouse Gas Emissions (Scopes 1, 2 and 3)
| FY2019 | FY2020 |
FY2021 |
FY2022 |
FY2023 |
FY2024 |
||
| tonnes-CO2e | tonnes-CO2e | tonnes-CO2e | tonnes-CO2e | tonnes-CO2e | tonnes-CO2e | Ratio | |
| Scope 1 emissions | 118 |
83 |
95 | 110 | 141 | 100 | 1% |
|---|---|---|---|---|---|---|---|
| Scope 2 emissions | 937 | 288 | 1 | 0 | 1 | 1 | 0% |
| Total Scope 3 emissions | 19,651 | 22,641 | 19,349 | 18,258 | 17,659 | 18,198 | 99% |
| Purchased goods and services | 12,705 | 14,647 | 13,139 | 12,242 | 11,753 | 11,902 | 65% |
| Capital goods | 353 |
342 |
324 | 92 | 47 | 9 | 0% |
| Fuel- and energyrelated activities not included in Scope 1 or Scope 2 | 124 |
126 |
130 | 168 | 153 | 147 | 1% |
| Upstream transportation and distribution | 1,480 |
1,838 |
1,817 | 1,813 | 1,881 | 2,153 | 12% |
| Waste generated in operations |
5 |
6 | 7 | 10 | 6 | 4 | 0% |
| Business travel |
577 |
92 | 13 | 190 |
247 |
356 | 2% |
| Employee commuting | 319 | 211 | 91 | 81 | 90 | 108 | 1% |
| Downstream transportation and distribution | 2,244 | 3,428 | 1,883 | 1,809 | 1,665 | 1,766 | 10% |
| Use of sold products |
101 |
108 | 99 | 158 | 151 | 240 | 1% |
| End-of-life treatment of sold products | 1,743 | 1,843 | 1,845 | 1,695 | 1,666 | 1,513 | 8% |
| Scope 1, 2 and 3 emissions | 20,706 | 23,012 | 19,445 | 18,368 | 17,801 | 18,299 | 100% |
[Boundary of calculations]
All sites of Lansinoh Laboratories Inc
CO2 Reduction and Energy Conservation Initiatives
Pigeon Group's Energy Consumption
Recognizing the need to address climate change and conserve depletable energy sources, we are working to save energy and switch to renewable energy at our facilities. Our total energy consumption in 2025 was 47,415MWh. The largest proportion of this was made up of electricity, which accounted for 79%.
Unit: MWh
|
Energy carriers |
FY2022 |
FY2023 |
FY2024 |
FY2025 |
| Fuel | 10,423 | 10,070 |
11,404 |
10,096 |
| Biofuels | 131 | 14 | 0 | 9 |
| Purchased electricty | 33,114 | 30,376 |
32,583 |
32,925 |
| Purchased heat | 26 | 20 | 15 | 16 |
| Electricity generated by own solar panels installed at our manufacturing sites | 3,368 | 3,990 |
4,546 |
4,369 |
| Total | 47,062 | 44,470 |
48,548 |
47,415 |
[Boundary of calculations]
Pigeon Corporation and all of the consolidated subsidiaries in Japan and overseas. (Coverage is 100%)
[Calculation method]
Fuel consumption is calculated based on higher heating values specified in the Energy Saving Act in Japan.
Use of Renewable Energy
The Pigeon Group advances the use of renewable energy as a means of reducing emissions of greenhouse gases. In 2025 electricity generated from renewable sources comprised 38 % of total electricity consumed by the Group, contributing to a 6,730 tonnes reduction in CO2 emissions.
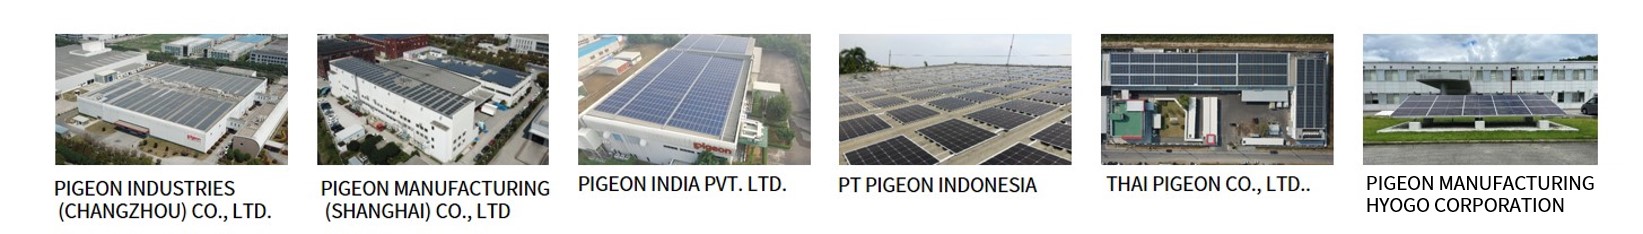
Solar panels have been installed at each manufacturing site to generate their own electricity while we have purchased electricity generated by renewable sources or Renewable Energy Certificates.
We began introducing photovoltaic (PV) power systems in 2019 and have now installed it at 10 domestic and overseas manufacturing and non-manufacturing sites. In order to further increase our self-power generation rate, we have installed additional photovoltaic (PV) power systems at two manufacturing sites in Thailand and one manufacturing site in Indonesia in 2024. We will continue to expand its usage of renewable energy and further advance our efforts for reduction of greenhouse gas emissions.
Pigeon Group's consumption of electricity from renewable sources and CO2 emissions avoided
| FY2022 | FY2023 | FY2024 | FY2025 | |||||||||
| Consumption (MWh) |
Percentage of total electricity consumption(%) | CO2 emissions avoided*⁴ (tonnes of CO2) |
Consumption (MWh) |
Percentage of total electricity consumption(%) | CO2 emissions avoided*⁴ (tonnes of CO2) |
Consumption (MWh) |
Percentage of total electricity consumption(%) | CO2 emissions avoided*⁴ (tonnes of CO2) |
Consumption (MWh) |
Percentage of total electricity consumption(%) | CO2 emissions avoided*⁴ (tonnes of CO2) |
|
| Total electricity consumption (renewable & non-renewable sources)*¹ | 36,482 | - | - | 34,366 | - | - | 37,130 | - | - | 37,294 | - | - |
|---|---|---|---|---|---|---|---|---|---|---|---|---|
|
Electricity generated from renewable energy sources |
6,021 | 17% | 3,085 | 6,860 | 20% | 3,404 | 8,922 | 24% | 4,328 | 14,286 | 38% | 6,730 |
|
Of which, electricity generatd by our own PV systems*² |
3,368 | 9% | 2,005 | 3,990 | 12% | 2,250 | 4,546 | 12% | 2,463 | 4,369 | 12% | 2,426 |
|
Of which, purchased electricty |
2,653 | 7% | 1,079 | 2,870 | 8% | 1,154 | 4,376 | 12% | 1,865 | 9,916 | 27% | 4,304 |
| Renewable Energy Certificates (RECs) purchased*³ | 13,844 | 38% | 7,174 | 12,882 | 37% | 6,534 | 16,163 | 44% | 8,533 | 14,405 | 39% | 7,151 |
Boundary: Pigeon Corporation and all its consolidated subsidiaries in Japan and overseas.(Coverage: 100%)
*¹ Electricity generated by own solar panels is included in.
*² Electricity generated by solar panels installed at our production sites and non-production sites are covered.
*³ Purchases of Renewable Energy Certificates (RECs) and J-credits generated from solar power generation are covered.
*⁴CO2 emissions avoided are calculated by multiplying a CO2 emission factor of electricity in each fiscal year, either a factor specific to the electricity supplier or an
average factor for the country in which the site locates, by in-house power generation and the quantity purchased respectively.
Our efforts to reduce CO2 Emissions in Logistics
To reduce CO2 emissions through logistics, we are shortening transportation distances, reducing transportation frequency, and switching to transportation methods that emit less CO2.
1.Reduction of transportation distance
We are working to shorten transportation distances by reviewing unloading locations and shipping bases.
- Shortened transportation distances by eliminating our own logistics bases and outsourcing to outside logistics providers located near ports (PIGEON MALAYSIA (TRADING) SDN.BHD.).
- Shortened the transportation distance of industrial waste by changing the industrial waste processor (PIGEON INDUSTRIES (THAILAND) CO.)
- Changed the port of shipment for imported raw materials to shorten the transportation distance (LANSINOH LABORATORIES MEDICAL DEVICES DESIGN INDUSTRY AND COMMERCE LTD.)
2.Reduction of transportation frequency
We are working to reduce the frequency of transportation by improving loading efficiency, reducing the percentage of empty vehicles, and improving procurement efficiency in cooperation with suppliers.
- Efforts are underway to change the number of items placed in the outer box, the method of packing in the box, and the size of the outer box (Pigeon Corporation).
- Reviewing packaging specifications to eliminate the need for inner layer material (Lansinoh Group)
- Collaborated with suppliers of secondary materials to improve the accuracy of demand forecasting and inventory control, and to reduce the frequency of transportation. (LANSINOH LABORATORIES MEDICAL DEVICES DESIGN INDUSTRY AND COMMERCE LTD.CO., PIGEON SINGAPORE PTE.LTD. and PIGEON MALAYSIA (TRADING) SDN.BHD.)
- Switched from wooden pallets to paper slip sheets, forest certified, and improved loading rates and significantly reduced transportation weight (LANSINOH LABORATORIES MEDICAL DEVICES DESIGN INDUSTRY AND COMMERCE LTD.CO., LANSINOH LABORATORIES, INC.)
3.Switching to transportation methods that emit less CO2
We are also switching to trucks that use cleaner fuels for transportation.
- Use of natural gas and biodiesel vehicles (THAI PIGEON CO., LTD.)
- Use of rail for some transportation between logistics centers as a modal shift measure* (Pigeon Corporation)
*Implementing from August 2024. Estimated reduction in CO2 emissions of 51.9t-CO2 (68.4%) and driver driving time of 1,613 hours (81.3% reduction) over the seven months until February 2025.
4.Initiatives at logistics centers
In parallel with improving transportation efficiency, logistics centers are also working to reduce CO2 emissions. (Pigeon Corporation)
- Adoption of LED lighting in offices and warehouses at major logistics centers
- Electrification of forklifts at major logistics centers
- Partial use of solar power (33%) (Tsukuba Logistics Center)
Developing Carbon Neutral (Climate Neutral) Products
Our Lansinoh business is actively working toward greenhouse gas (GHG) emissions reduction goals based on scientific evidence. To begin with, Lansinoh has completely switched to renewable energy for the electric power used at all of its sites. It has also calculated the full carbon footprint of its main products, opened negotiations with suppliers about using renewable energy in order to reduce their emissions, and begun actively working toward GHG emissions reduction at the product level. In 2021, Lansinoh was the first company in the Pigeon Group to launch products certified climate-neutral by a third party (the DFCE Institute). The products are certified climate-neutral because Lansinoh has determined their GHG emissions over their entire life cycle (from raw material procurement to disposal after use) and is not only independently working to reduce these emissions but also striving to compensate for emissions that are difficult to eliminate by purchasing climate credits, which support activities by environmental groups certified to reduce and absorb greenhouse gases.

Other Initiatives
・Eliminating electricity generation from fuel oil
In order to reduce GHG emissions, in fiscal 2020 we stopped using electric generators that use fuel oil. (Pigeon Manufacturing Hyogo)
・Energy efficiency through LED lighting
We are making progress on the changeover to LED lighting, and using less electricity in our offices and other sites. (Central Laboratory, Tsukuba office, Pigeon Manufacturing Ibaraki)
Further Initiatives
Although we have not introduced ICP (Internal Carbon Pricing), we have set long-term GHG reduction targets in consideration of the future rise of carbon taxes and Japan's reduction target of carbon neutrality by 2050. During the discussion process, we refer to the IEA's forecast of carbon tax increase in order to promote shifts to renewable energy, application of renewable energy certificates, and capital investment for the purpose of energy conservation and on-sites renewable energy generation.
Response to CDP Corporate Questionnaire
Pigeon responded to CDP Corporate Questionnaire (Climate Change and Water Security) conducted by CDP*, a non-profit organization. Please refer to the PDF file below for 2025 answer(Japanese language only).
*CDP is a non-profit organization whose purpose is to promote environmental measures by supporting companies and local governments to disclose information regarding measures to address environmental impacts such as climate change, water resource protection, and forest conservation, based on requests from institutional investors and others who are highly concerned about environmental issues.