


The Pigeon Group promotes the conservation of natural resources and recycling, strives to reduce resource usage and waste production across the entire Group and lessen its burden on the environment, and contributes to the realization of a sustainable circular economy in order to “leave a rich Earth for the future of babies born tomorrow.”
Initiatives to Achieve a Circular Society

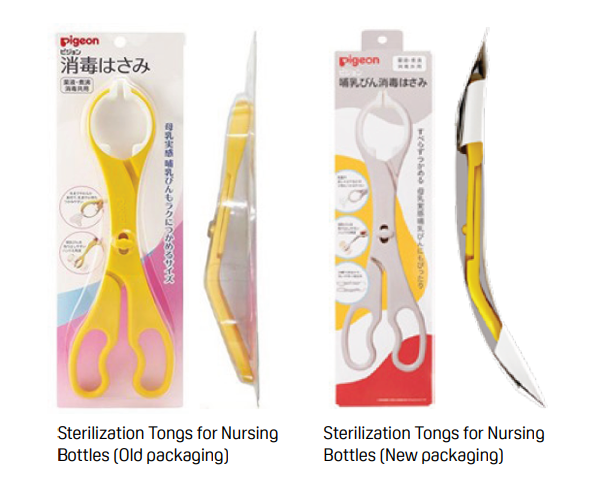
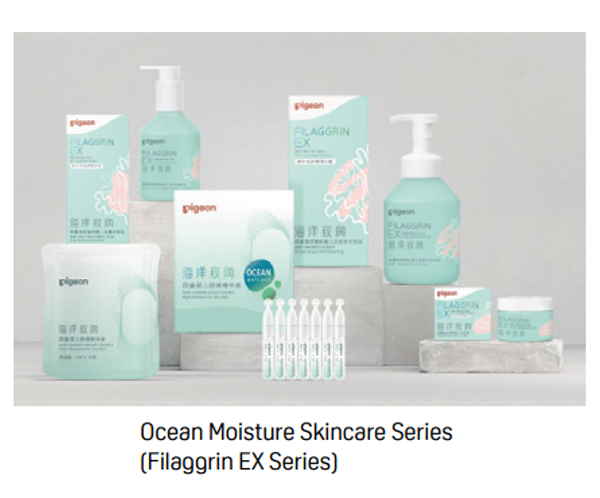
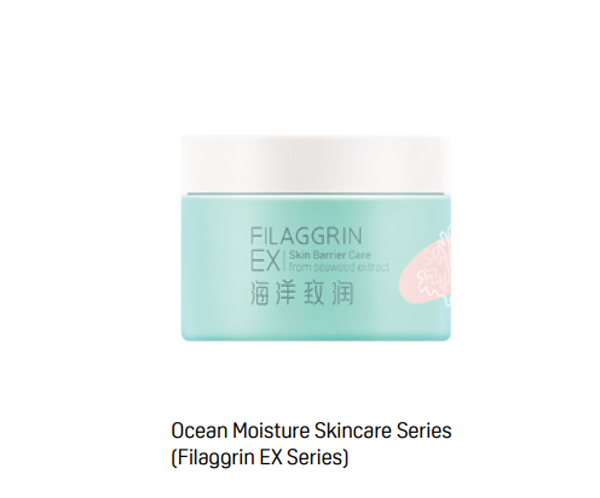
Global plastic consumption is on the rise, and much of the Pigeon Groupʼs product packaging uses plastic as well. To achieve a sustainable society, we promote circular monozukuri (manufacturing) by overseeing products throughout their entire life cycle. We are working to reduce the use of petroleum-based virgin plastic, aiming to increase the proportion of plant-based or recycled materials in our product packaging to 50% by weight by 2030. In Japan, the packaging for Sterilization Tongs for Nursing Bottles, which previously featured plastic blister packaging on paper backings, has been replaced with forest-certified paper. This has led to a substantial reduction in plastic usage in the packaging. We are continuously exploring alternative materials to plastic for packaging toiletry and skincare products. In China, our Ocean Moisture Skincare Series (Filaggrin EX Series*), launched in July 2023, features jars made from 100% recycled plastic (excluding lids), and the individual boxes for each product in the series are made from forest-certified paper.
*Filaggrin, a vital protein found within the skinʼs stratum corneum cells, serves as the precursor to natural moisturizing factors (NMF), which play a crucial role in skin hydration.

The Pigeon Group aims to make all product packaging reusable, recyclable, and/or compostable by design by 2030. “Reuse” is defined as the ability for a product to be used again for the same purpose after initial use, while “recycling” refers to the ability for customers to easily disassemble the product packaging into parts such as caps, bottles, and labels, with each part composed of a single material rather than composite materials. In 2023, packaging for 81% of all stock keeping units (SKUs) sold by the Pigeon Group met this standard. However, the packaging of wet wipes, baby food pouches, and the shrink film of certain products are made of composite materials, making them unsuitable for recycling.
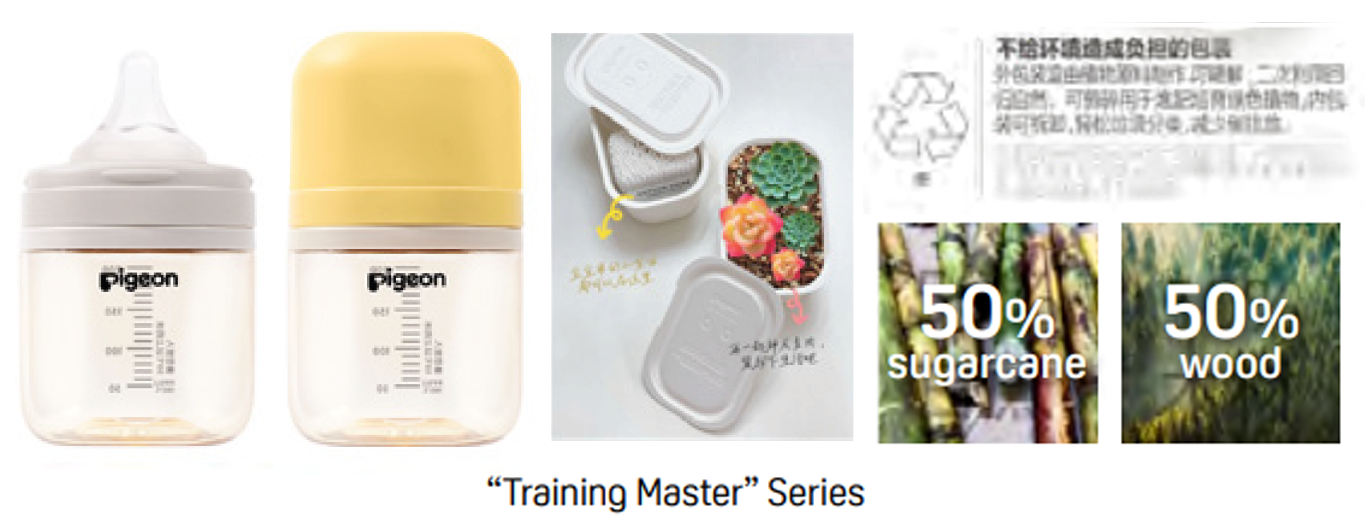
In 2024, the Pigeon Group launched the new “Training Master” series of baby drink cups in China. This series is made with 50% sugarcane and 50% wood pulp for the product packaging material. It also has waterproof functionality, allowing it to be used for a long time as a small container or a flowerpot. Furthermore, after fulfilling its purpose, the packaging can be crushed to achieve compostable product packaging. We will continue to explore packaging materials that are reusable, recyclable, and/or compostable.
Reducing Industrial Waste and Promoting Recycling
The Pigeon Group is working to reduce the amount of industrial waste generated in the course of its business activities that is not reused or recycled. Under our 7th Medium-Term Business Plan (2020–2022), our goal is to reduce the volume of industrial waste per unit of sales by at least 1% per year. In 2022, we achieved a 28% reduction compared with 2021 and an 80% reduction compared with fiscal 2018. At our production subsidiaries over the three-year period from 2020 to 2022, we worked to reduce raw material losses by improving productivity and yield. We also made other improvements, such as reviewing the design of product packaging to minimize the volume of materials discarded during the production process. For industrial waste that is not recycled, we reviewed our disposal vendors and entered into contracts with those who can properly recycle such waste. Going forward, we will continue our efforts with the goal of maintaining a reuse and recycling rate of 95% or more.

*Scope of data collection: Pigeon Corporation and its domestic and overseas consolidated subsidiaries
Notes:1. Calculations for domestic operations for December 2019 are based on the 11-month period from February 1 to December 31, 2019, due to a change in the fiscal year-end.
2.Recycling includes reuse and thermal recycling.
Water Resource Conservation
According to the Organization for Economic Cooperation and Development (OECD), population growth, rapid urbanization, and economic growth are projected to increase water demand by 55% by 2050, resulting in serious water shortages for 3.9 billion people, more than 40% of the world population. In addition, there are already countries and regions where water supply and demand are tight and water is in short supply.
We recognize these issues related to water resources and have been continuously working to improve usage efficiency and reduce water consumption by defining the difference between water withdrawn and discharge as water consumption, continuously reviewing and improving manufacturing processes, purifying and reusing water used in manufacturing, and implementing other initiatives at our factories.
Initiatives to Reduce Water Consumption (Water Recycling) in Japan
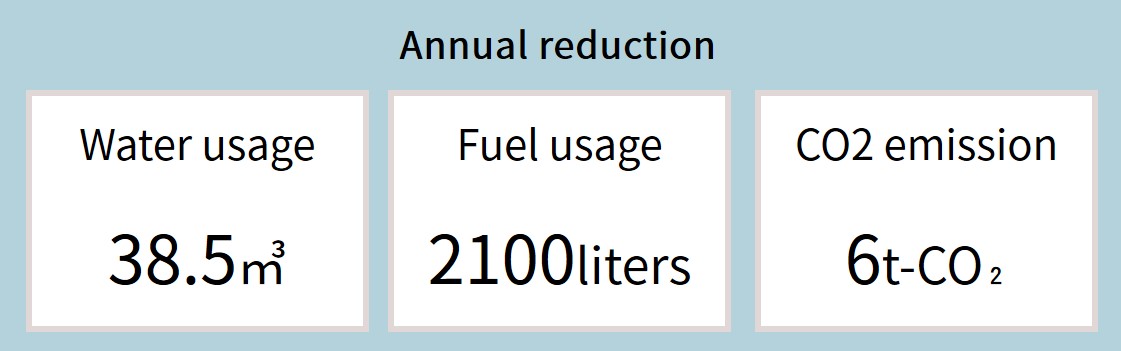
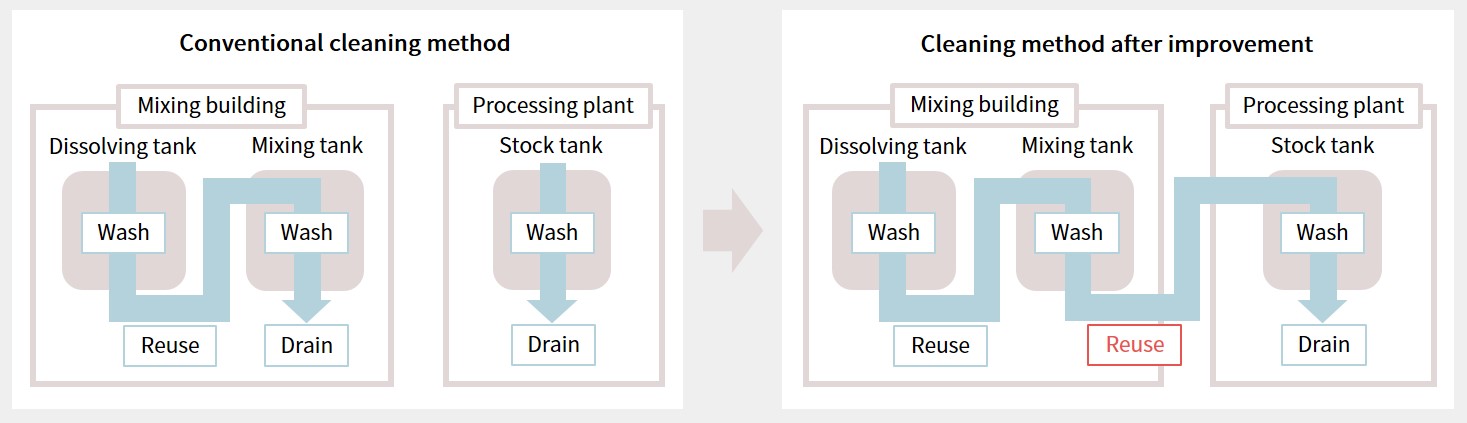
Pigeon Manufacturing Ibaraki Corporation has improved the process of cleaning chemical tanks after production, which previously required new water to be added to each tank for cleaning after production. In order to reduce water consumption, the process was reviewed and started to reuse the cleaning water to clean chemical tanks since May 2022. Previously, dissolution tanks, blending tanks, and stock tanks were cleaned separately, and the cleaning water used for each tank was treated as wastewater and condensed using boiler heat instead of being reused. After the improvement, they now reuse the cleaning water used to clean dissolution tanks to clean mixing tanks as well as stock tanks. This initiative is expected to reduce water consumption by 38.5 m³ per year. The reduction in water consumption will also reduce the amount of fuel used for wastewater concentration treatment by approximately 2100 liters per year, which translates into a reduction which is equivalent to approximately 6 tonnes of CO2 emissions.
-
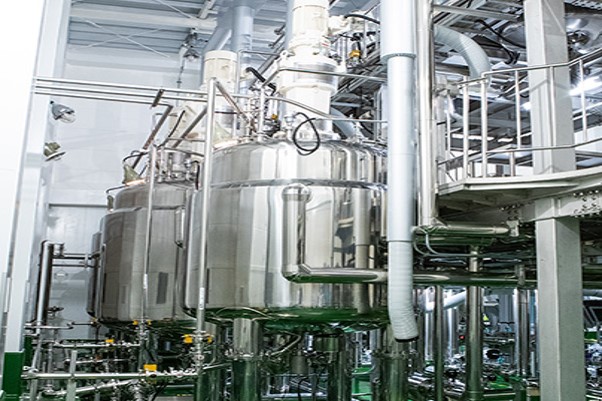
Chemical tanks in Pigeon Manufacturing Ibaraki
Initiatives to Reduce Water Consumption (Water Recycling) in Thailand
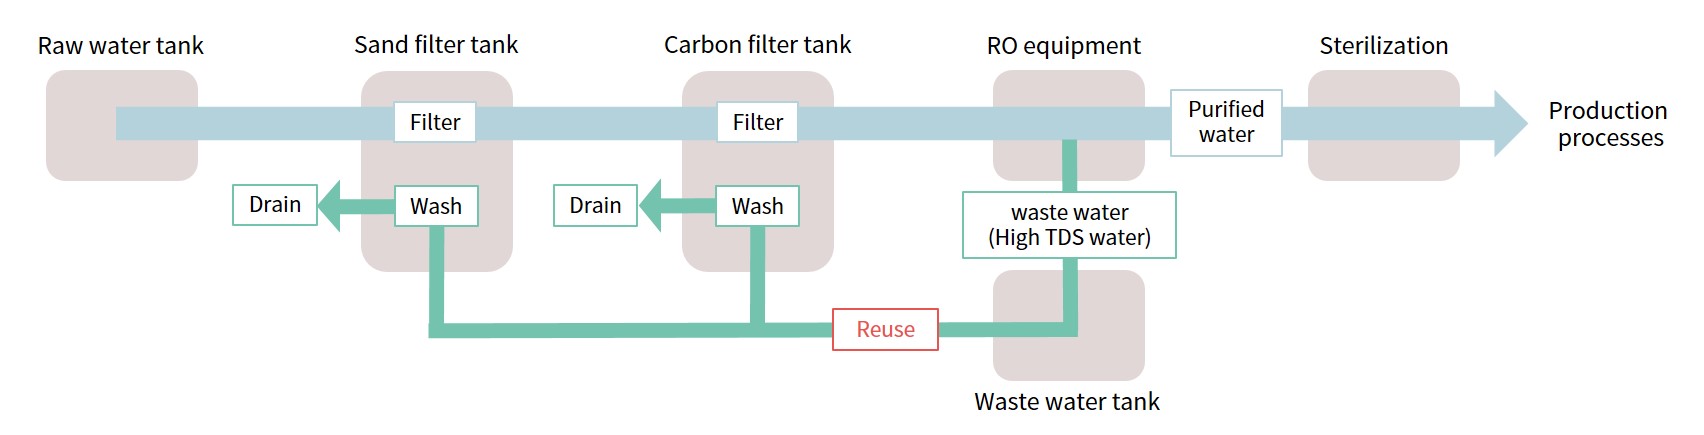
Pigeon Industries (Thailand) Co., Ltd. produces pure water by treating withdrawn water with filtration equipment and a reverse osmosis water purifier (RO membrane) and uses the pure water in its manufacturing processes. Impurity-concentrated water is discharged from the reverse osmosis system as wastewater, which is reused as cleaning water for the filters in the sand filtration tanks and activated carbon filtration tanks. This measure has led to an annual reduction of 900m³ in the amount of withdrawn water used to clean the filtration tanks.
Water risk assessment of our manufacturing sites
The "maximum available water resources per capita" is often used as an indicator to assess water stress (the degree of pressure on water supply and demand). According to this indicator, the minimum amount of water resources required for daily life, agriculture, industry, energy, and the environment is defined as1,700 m³ per capita per year, and if it falls below this level, the country is considered to be "under water stress. We use "Aquastat" developed by FAO (Food and Agriculture Organization of the United Nations) as a tool to assess water risks in specific countries on a global level where our manufacturing sites are located, and identified India, where Pigeon India Pvt. Ltd. is located, as a country with water stress.
|
Country of origin of |
Aquastat |
Water Stress/Risk Assessment |
| Japan | 3,380 | ー |
| China | 1,946 | Fragile |
| India | 1,413 | Under water stress |
| Thailand | 6,317 | ー |
| Indonesia | 7,542 | ー |
| Turkey | 2,570 | ー |
Based on published data from FAO's (Food and Agriculture Organization of the United Nations) Aquastat
Our factory operating in India under water stress, PIGEON INDIA PVT.LTD., primarily manufactures molded products such as nursing bottles and silicone nipples and does not manufacture products that depend on water resources such as skin care products and detergents. Its water consumption is less than 1% of the water intake at all of our production sites. However, we are aware of the water resource issues in the region where the factory is located and are working on water conservation activities. The annual water intake is about 1,200m³, all of which is sourced from groundwater, and the water is purified and used within the plant. The water used is reused for watering plants and lawns on its premises. At this point, we have not identified any water risks that could affect our business activities or the environment, but we will continue to proactively obtain environmental information, including environmental laws and regulations, and apply it to water conservation activities at the plant to improve water use efficiency and strengthen water conservation management.
Water consumption and wastewater volume at production sites
Water consumption and wastewater volume at 10 of the Pigeon Group's total production sites (100% coverage) are shown in the figure below.
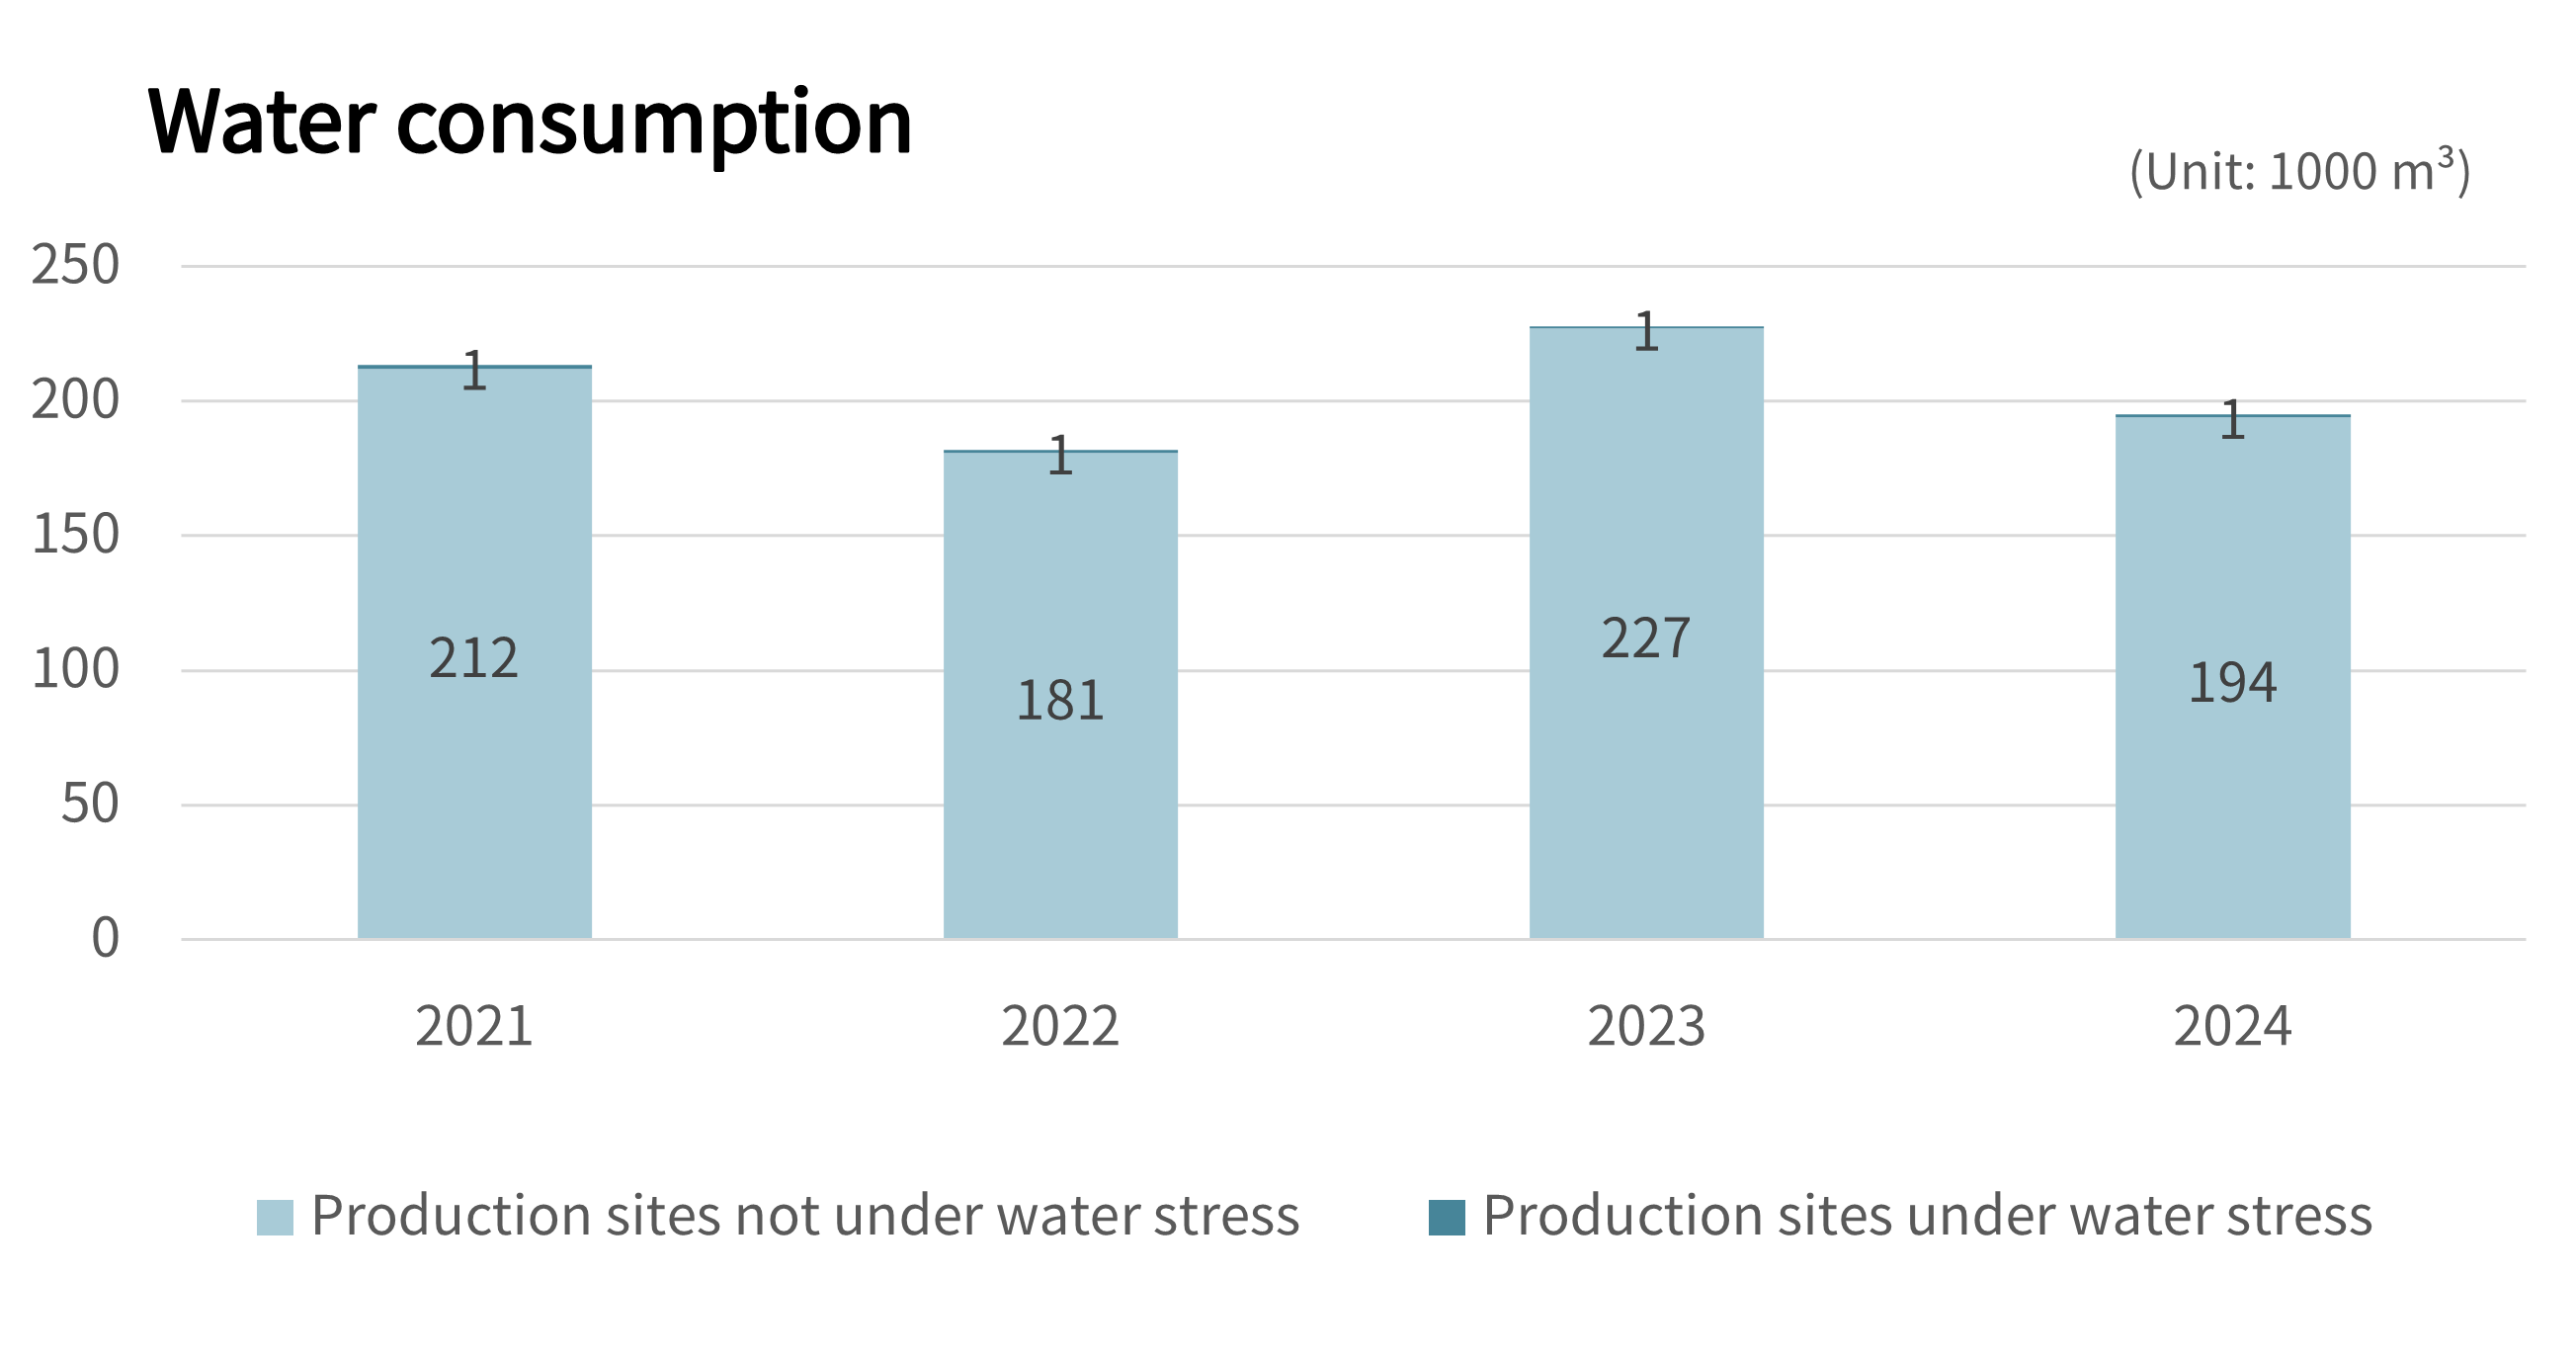
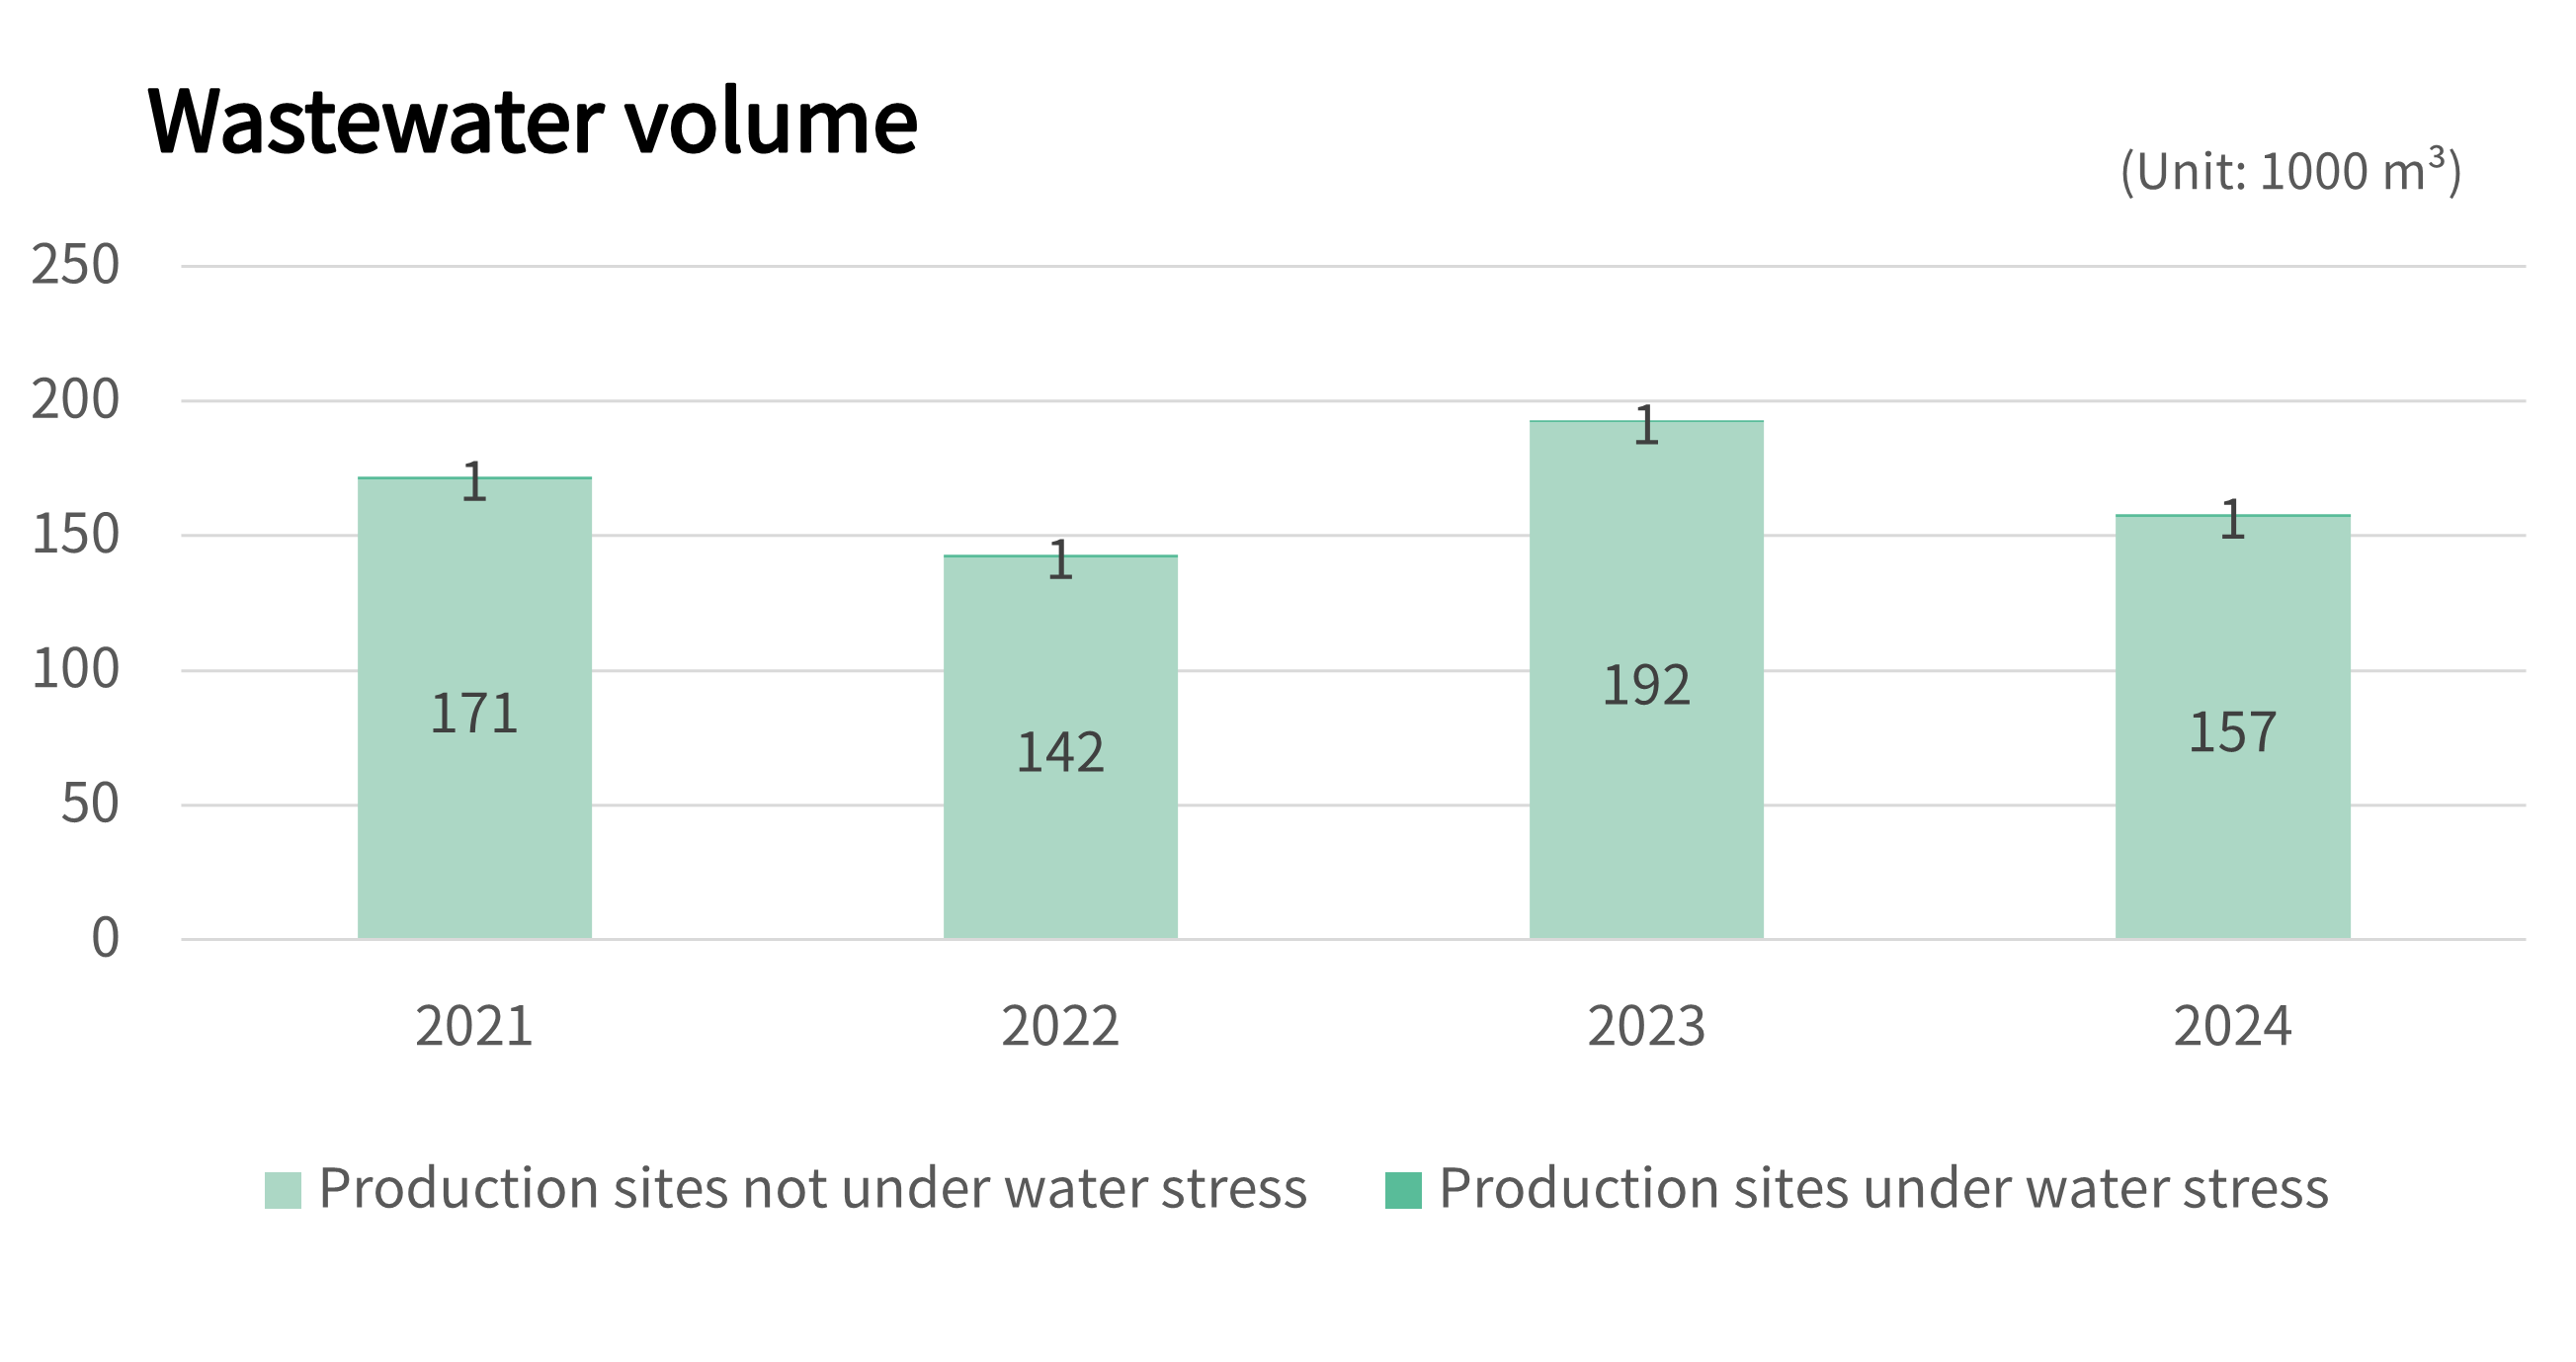
Boundary: Pigeon Corporation's all manufacturing subsidiaries (Coverage: 100% of production sites of the Pigeon Group)
Please refer to the ESG Data Book for water withdrawal and discharged volumes by site.
Production base under water stress: PIGEON INDIA PVT.LTD